Versions (relevant - OpenSearch/Dashboard/Server OS/Browser): Opensearch 2.14
Describe the issue : I was trying to add the victoria metrics endpoint as the Prometheus Datasource for Opensearch. Eventhough the datasource is created, i am not seeing any metrics in the Dashboard. The same victoria metrics endpoint we have configured as a datasource in grafana & it works well. Any fix or suggestions?
Configuration :
Relevant Logs or Screenshots :
Hello,
Would you mind to share a configuration for OpenSearch? I will try to reproduce it by myself.
I have the same problem on 3.2.0.
if I change victoriametrics to prometheus, no problem
my logs
[2025-08-27T23:06:30,739][INFO ][o.o.o.r.ObservabilityRestHandler] [opensearch-node1] observability:executeGetRequest idList:[] types:[savedVisualization], from:0, maxItems:1000, sortField:null, sortOrder=null, filters={}
[2025-08-27T23:06:30,739][INFO ][o.o.o.a.ObservabilityActions] [opensearch-node1] observability:ObservabilityObject-get []
[2025-08-27T23:06:30,739][INFO ][o.o.o.a.ObservabilityActions] [opensearch-node1] observability:ObservabilityObject-getAll
[2025-08-27T23:06:30,744][INFO ][o.o.o.i.ObservabilityIndex] [opensearch-node1] observability:getAllObservabilityObjects types:[savedVisualization] from:0, maxItems:1000, sortField:null, sortOrder=null, filters={} retCount:0, totalCount:0
[2025-08-27T23:06:30,744][INFO ][o.o.s.p.PPLService       ] [opensearch-node1] [94f70725-b0b3-43eb-8db0-43c9b0387c18] Incoming request describe  | where CONNECTOR_TYPE = *** | fields + DATASOURCE_NAME
[2025-08-27T23:06:30,793][INFO ][o.o.s.p.PPLService       ] [opensearch-node1] [8cdee3bd-a76f-46c9-ad03-421eb9549872] Incoming request source=my_prometheus.information_schema.tables
no errors on victoriametrics side
pablo
September 17, 2025, 2:39am
4
@burianov @shs_tech It doesn’t work for me either./api/v1/query, but I was getting HTTP 400
PrometheusClientException: Request to Prometheus is Unsuccessful with code : 400
Grafana has a separate plugin to handle Prometheus and Victoria Metrics. The metrics format could be the same, but Prometheus and VM might handle APIs differently.
pablo
September 17, 2025, 10:39am
5
@shs_tech @burianov I did further investigation.
When I used an incorrect endpoint with VM as data source, the VM logs produced these errors
victoriametrics  | 2025-09-17T01:53:22.676Z     warn    VictoriaMetrics/app/vmselect/main.go:214        remoteAddr: "192.168.1.1:59202"; requestURI: /api/v1/query; missing `query` arg
victoriametrics  | 2025-09-17T02:19:38.054Z     warn    VictoriaMetrics/lib/httpserver/httpserver.go:361        remoteAddr: "192.168.1.74:35730"; requestURI: /api/v1/query/api/v1/metadata; unsupported path requested: "/api/v1/query/api/v1/metadata"
victoriametrics  | 2025-09-17T02:19:38.057Z     warn    VictoriaMetrics/lib/httpserver/httpserver.go:361        remoteAddr: "192.168.1.74:35732"; requestURI: /api/v1/query/api/v1/metadata; unsupported path requested: "/api/v1/query/api/v1/metadata"
victoriametrics  | 2025-09-17T02:19:40.522Z     warn    VictoriaMetrics/lib/httpserver/httpserver.go:361        remoteAddr: "192.168.1.74:35740"; requestURI: /api/v1/query/api/v1/metadata; unsupported path requested: "/api/v1/query/api/v1/metadata"
victoriametrics  | 2025-09-17T02:23:28.715Z     warn    VictoriaMetrics/lib/httpserver/httpserver.go:361        remoteAddr: "192.168.1.74:40886"; requestURI: /prometheus/api/v1/query/api/v1/metadata; unsupported path requested: "/prometheus/api/v1/query/api/v1/metadata"
victoriametrics  | 2025-09-17T02:23:28.720Z     warn    VictoriaMetrics/lib/httpserver/httpserver.go:361        remoteAddr: "192.168.1.74:40900"; requestURI: /prometheus/api/v1/query/api/v1/metadata; unsupported path requested: "/prometheus/api/v1/query/api/v1/metadata"
victoriametrics  | 2025-09-17T02:23:32.584Z     warn    VictoriaMetrics/lib/httpserver/httpserver.go:361        remoteAddr: "192.168.1.74:40902"; requestURI: /prometheus/api/v1/query/api/v1/metadata; unsupported path requested: "/prometheus/api/v1/query/api/v1/metadata"
victoriametrics  | 2025-09-17T02:25:03.795Z     warn    VictoriaMetrics/lib/httpserver/httpserver.go:361        remoteAddr: "192.168.1.74:34832"; requestURI: /prometheus/api/v1/api/v1/metadata; unsupported path requested: "/prometheus/api/v1/api/v1/metadata"
victoriametrics  | 2025-09-17T02:25:03.811Z     warn    VictoriaMetrics/lib/httpserver/httpserver.go:361        remoteAddr: "192.168.1.74:34842"; requestURI: /prometheus/api/v1/api/v1/metadata; unsupported path requested: "/prometheus/api/v1/api/v1/metadata"
victoriametrics  | 2025-09-17T02:25:22.673Z     warn    VictoriaMetrics/lib/httpserver/httpserver.go:361        remoteAddr: "192.168.1.74:60468"; requestURI: /prometheus/api/v1/api/v1/metadata; unsupported path requested: "/prometheus/api/v1/api/v1/metadata"
victoriametrics  | 2025-09-17T02:25:43.259Z     warn    VictoriaMetrics/lib/httpserver/httpserver.go:361        remoteAddr: "192.168.1.74:33886"; requestURI: /prometheus/api/v1/series/api/v1/metadata; unsupported path requested: "/prometheus/api/v1/series/api/v1/metadata"
victoriametrics  | 2025-09-17T02:25:43.280Z     warn    VictoriaMetrics/lib/httpserver/httpserver.go:361        remoteAddr: "192.168.1.74:33900"; requestURI: /prometheus/api/v1/series/api/v1/metadata; unsupported path requested: "/prometheus/api/v1/series/api/v1/metadata"
victoriametrics  | 2025-09-17T02:25:46.525Z     warn    VictoriaMetrics/lib/httpserver/httpserver.go:361        remoteAddr: "192.168.1.74:33088"; requestURI: /prometheus/api/v1/series/api/v1/metadata; unsupported path requested: "/prometheus/api/v1/series/api/v1/metadata"
victoriametrics  | 2025-09-17T02:26:15.551Z     warn    VictoriaMetrics/app/vmselect/main.go:232        remoteAddr: "192.168.1.1:53919"; requestURI: /prometheus/api/v1/series; missing `match[]` arg
victoriametrics  | 2025-09-17T02:26:24.070Z     warn    VictoriaMetrics/lib/httpserver/httpserver.go:361        remoteAddr: "192.168.1.1:53919"; requestURI: /prometheus/api/v1; unsupported path requested: "/prometheus/api/v1"
victoriametrics  | 2025-09-17T02:26:29.818Z     warn    VictoriaMetrics/app/vmselect/main.go:214        remoteAddr: "192.168.1.1:53919"; requestURI: /prometheus/api/v1/query; missing `query` arg


victoriametrics  | 2025-09-17T10:30:52.796Z     warn    VictoriaMetrics/lib/httpserver/httpserver.go:361        remoteAddr: "192.168.1.74:55430"; requestURI: /api/ve/query/api/v1/metadata; unsupported path requested: "/api/ve/query/api/v1/metadata"
victoriametrics  | 2025-09-17T10:30:52.797Z     warn    VictoriaMetrics/lib/httpserver/httpserver.go:361        remoteAddr: "192.168.1.74:55422"; requestURI: /api/ve/query/api/v1/metadata; unsupported path requested: "/api/ve/query/api/v1/metadata"
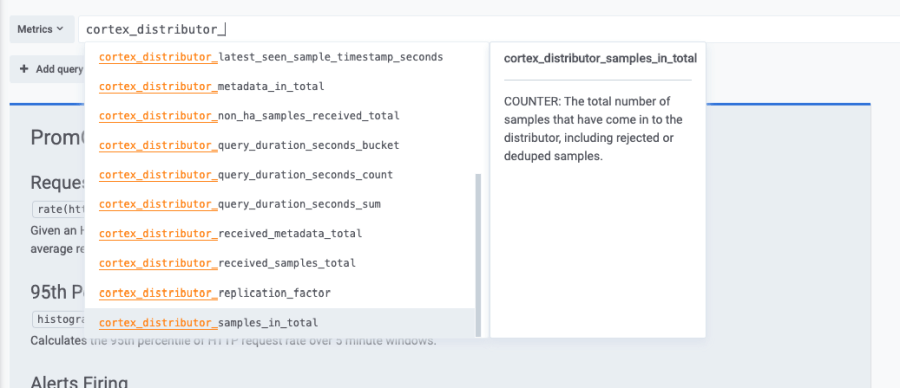
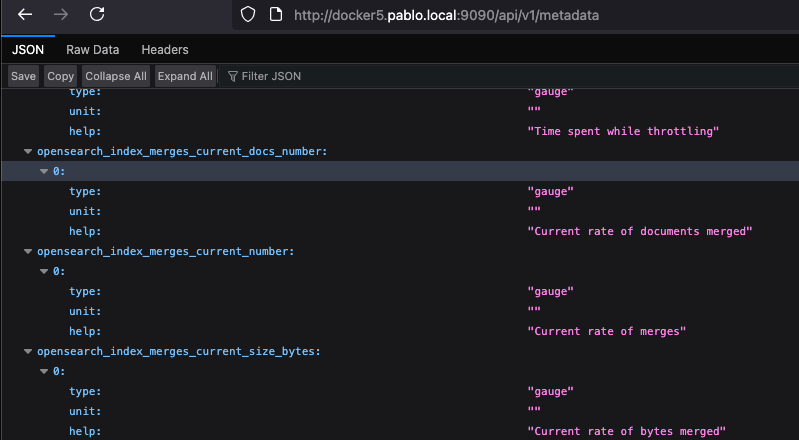
So it looks like, Prometheus data source is using /api/v1/metadata
If you run the /api/v1/metadata against Prometheus and VM, you’ll find that Prometheus produces output with all metrics.
and VM returns an empty list
That’s why you can’t see any metrics in OpenSearch when using VM as a data source.
opened 07:38PM - 11 Aug 22 UTC
enhancement
support
**Is your feature request related to a problem? Please describe.**
This featu… re request is to support the [Prometheus Metric Metadata API](https://prometheus.io/docs/prometheus/latest/querying/api/#querying-metric-metadata) at `/api/v1/metadata` in Prometheus [v2.15.0+](https://github.com/prometheus/prometheus/blob/main/CHANGELOG.md#2150--2019-12-23). Similar to #643, but this endpoint returns metadata about scraped metrics without any associated target information.
`vmselect` currently returns an empty placeholder response for this endpoint (see e6bf88a4d4948d60b9f1b9c432db46af7001368c).
More generally, the request is for VictoriaMetrics to support metric metadata throughout its Prometheus-compatible components. In addition to implementing `/api/v1/metadata`, metadata would need to be scraped from Prometheus targets and also propagated via Prometheus remote-write, using the `metadata` field added to the Prometheus remote-write protocol in [v2.23.0](https://github.com/prometheus/prometheus/blob/main/CHANGELOG.md#2230--2020-11-26).
**Describe the solution you'd like**
A full solution for Prometheus metadata would require updates to a few components:
- `vmselect` implements the `/api/v1/metadata` endpoint with a response containing at least one metadata object per metric name.
- `vmstorage` adds support for storing metric metadata.
- If implementing separate metadata storage is not feasible, a workaround could be to store metadata using a special internal metric name (e.g., `_prometheus_metadata`) with metadata stored in `metric`, `type`, `help`, `unit` labels, requiring no change to `vmstorage` itself.
- `vmagent` scrapes metadata from Prometheus targets, and add the `metadata` field to `remote_write` requests it sends.
- Both `vmagent` and `vminsert` extract the `metadata` field from `remote_write` requests they receive.
**Describe alternatives you've considered**
Since Victoriametrics currently ignores Prometheus metric metadata, the only alternative would be to proxy this endpoint to another handler which serves metric metadata stored in another system.
**Additional context**
Since the introduction of the Metric Metadata API, metric metadata has become an increasingly critical part of the Prometheus user experience.
One key use-case related to this feature request is to support Grafana's [in-line metrics help text](https://grafana.com/blog/2020/06/15/how-we-made-working-with-prometheus-easier-with-metric-metadata-in-grafanas-explore-view/) when using VictoriaMetrics as a Prometheus datasource: