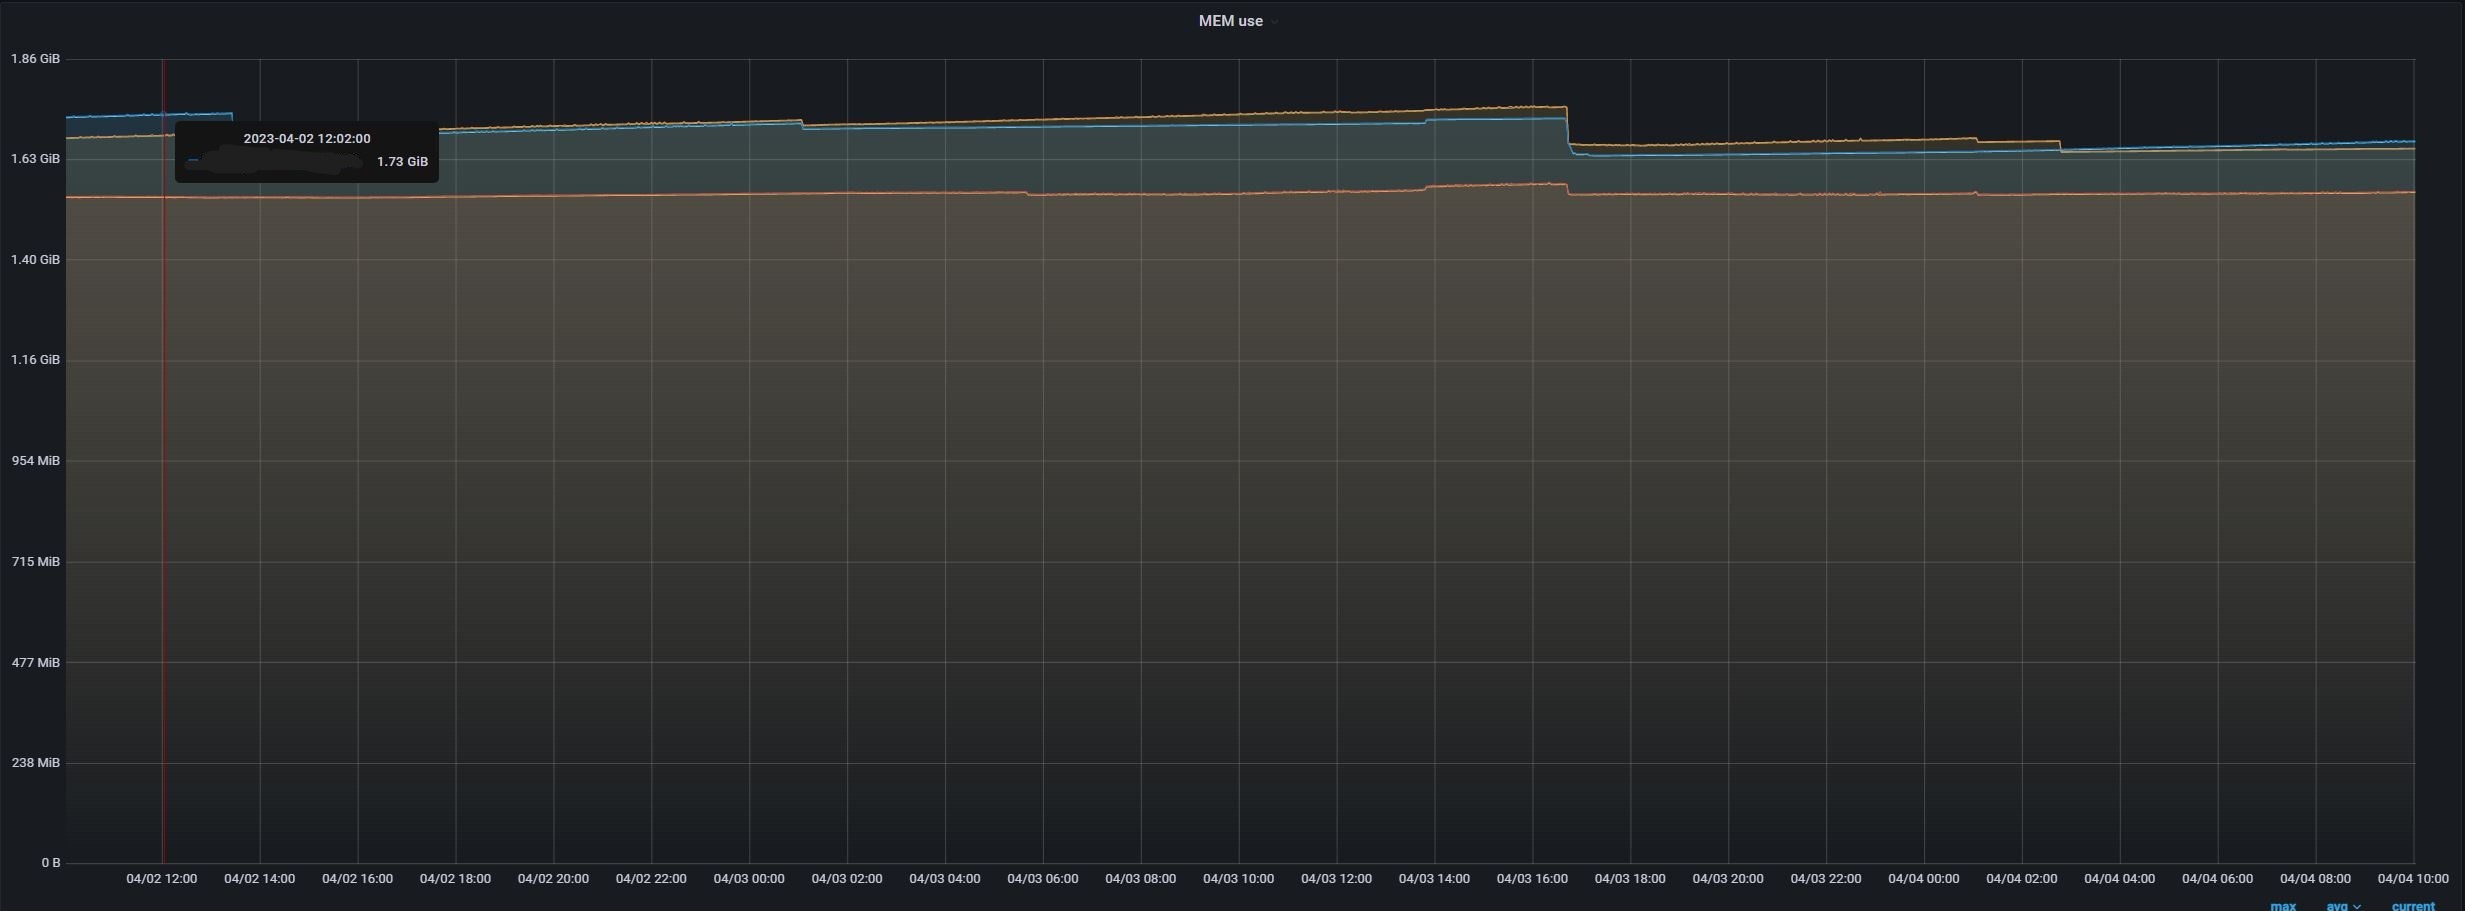
We are seeing constant increase in memory usage in our OpenSearch pods. The cluster is not busy and it does not have significant data stored in it. Data was not being added to the cluster when the memory increase was noticed.
The behavior is similar in OS 1.3.7 and above and OS 2.x . Comparatively we noticed lower memory usage in OS 1.3.6.
_nodes/stats API is showing a JVM Heap usage around 40 percent with the Operating System’s memory usage around 95%
Is this normal behavior or is it something that requires further investigation?
It’s normal for heap usage to go up and down and OpenSearch works on stuff and generates garbage, which is then cleaned up.
As for RAM, is this “reserved” or does it include buffered/cached RAM? Because RES shouldn’t go up with time, at least not significantly. Meanwhile, cached RAM is normal to go up as OpenSearch reads files on disk - the OS will free it up when needed.