if setting preference=_primary_first, search operations are always fast costing 40ms
if preference=replica,the first query will be slow spending 2-5s after a few time silence
this happens when there are some bulking operations
set request_cache=false does not help
“first query is slow, then fast, if stop query for 1 minute, then first query will be slow” sounds like cache-miss question, but making datanode from 32G to 256G does not help and closing query-cache, request-cache, fielddata-cache are all useless
this query works on oss based cluster to make this more obvious,while on SSD, slow query spend 3-5s;
More confusing, After refresh_interval of target index was set to 1s explicitly which is exactly equal to the default value, no slow query appears ???!!!
From initial testing I don’t see any consistent difference, if you could provide a sample of the bulk and size of the index, total shards and replicas.
two datanode(8c32G) and one clustermanager node(8c32G)
6 primary shard with 6 replica shards
every shard: “p STARTED 1553477 1.6gb”
query is just like : “from”:0,“size”:40,“query”:{“bool”:{“must”:[{“term”:{“commodity_status”:{“value”:20,“boost”:1.0}}},{“term”:{“commodity_show_status”:{“value”:0,“boost”:1.0}}},{“terms”:{“template_id”:… “adjust_pure_negative”:true,“boost”:1.0}},“sort”:[{“commodity_update_time”:{“order”:“desc”}}],“track_total_hits”:false
bulk is just update these existed doc with 500 TPS(translog: request)
Besides
I think this is relevent to IO, because in my mirro cluster which is based on “oss file system“, searching with replica spend 30-50s while _primary 40ms
what make me confused are :
I can not grap a waiting stack with jstack, it seems like there is no any long waiting action
I print on- cpu and wall time flamegraph every 5s repeating 6 times constantly (30s totally repeat 3 times)(on oss fs cluster to make things easier for jstack or asprof), however
first 2 or 3 on-cpu graphs show there is no runing search stack, which seems mean no-search-operation or ‘blocked before search threadpool‘ in this 10-15s? {picture: no-search-stack}
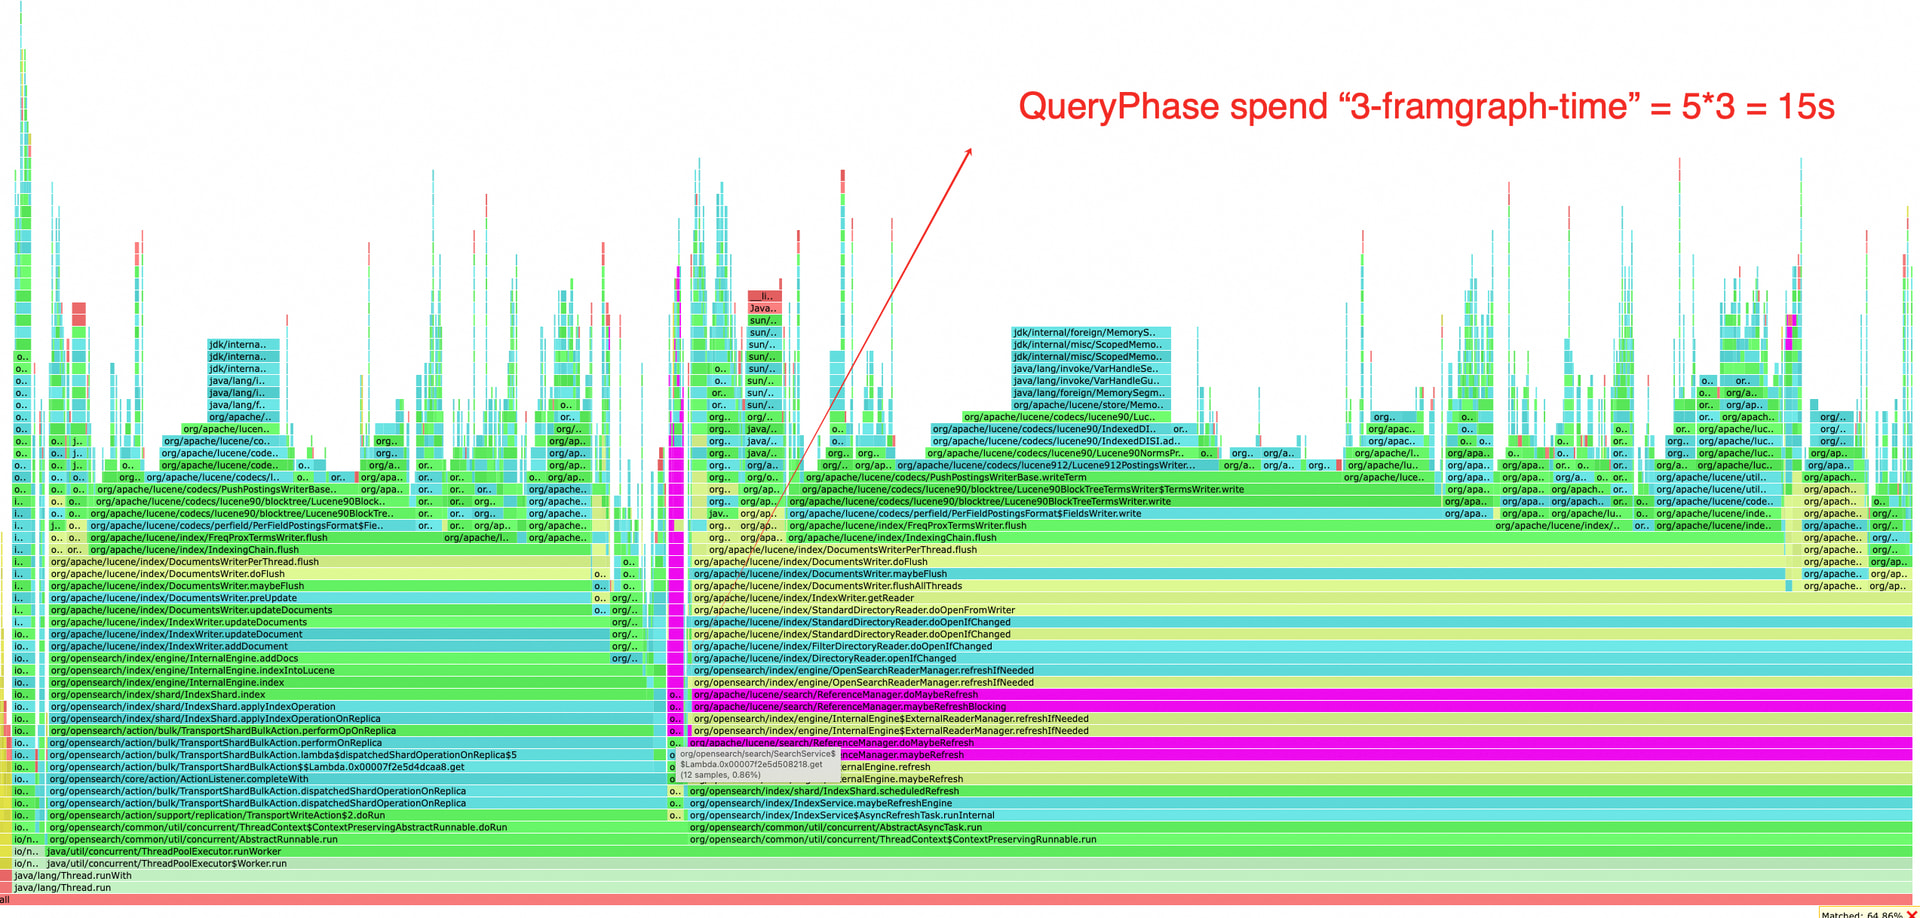
last 3 or 4 on-cpu graph, “org/opensearch/search/SearchService.executeQueryPhase“, which means search action exactly cost 20s {picture: QueryPhase}
on wall-time graph, no openseach waiting {picrute: wall-time}