Versions (relevant - OpenSearch/Dashboard/Server OS/Browser):
- Opensearch : 3.2.0
- Opensearch Operator : 2.8.0
- Environment : EKS 1.30
- Instance Type : m6g
- Volume : GP3 (IOPS, ThroughPut MAX)
Describe the issue:
Hi.
I`m migrating from elasticsearch to opensearch.
I am in the process of testing the speed of recovery and replication.
We are checking the replication speed with the following settings.
Test Index is almost 100GiB.
PUT /my_embedding_index/_settings
{
  "number_of_replicas": 1
}
What I’ve done: Change recovery speed, set file chunks, and more with Cluster Settings
Changing settings such as max_bytes_per_sec, node_concurrent_recoveries, etc.
speeds up only in the beginning and then slows down exponentially from a certain point in time.
Nothing worked.
The peculiarities I found are as follows.
- Network Bandwidth is not problem
- Disk IO Exceeded and Throughput is not problem
- EBS Idle time is almost zero

The difference between Elastic Search and Open Search
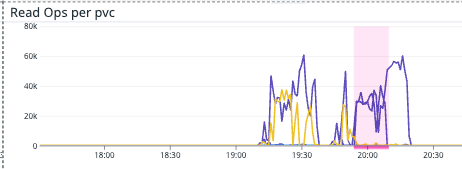
[ Opensearch : 3~4k ]
Read IOPs are stuck at some point.

[ ElasticSearch : 60k ]
ElasticSearch is far more disk IOPs than Opensearch.
Device:         rrqm/s   wrqm/s     r/s     w/s    rkB/s    wkB/s avgrq-sz avgqu-sz   await r_await w_await  svctm  %util
nvme2n1           0.00     0.00 1750.00    0.00  7000.00     0.00     8.00     0.98    0.56    0.56    0.00   0.57  99.00

avg-cpu:  %user   %nice %system %iowait  %steal   %idle
           2.59    0.00    1.05    5.97    0.00   90.39

Device:         rrqm/s   wrqm/s     r/s     w/s    rkB/s    wkB/s avgrq-sz avgqu-sz   await r_await w_await  svctm  %util
nvme2n1           0.00     8.00 1746.00   22.00  6984.00   120.00     8.04     1.01    0.57    0.56    1.50   0.54  96.00
I don`t know why opensearch uses so high Disk IOPS and So high Utilization.
Configuration:
ElasticSearch and Opensearch is almost same configuration and Computing spec.
Relevant Logs or Screenshots: