@VigneshP Thank you for the post. This is a known issue in visualisation, there is already an open issue for this.
A possible workaround can be to use VEGA.
Using the sample data you provided you could use the following json:
{
  "$schema": "https://vega.github.io/schema/vega/v5.json",
  "data": [
    {
      "name": "patients",
      "url": {
        "%context%": true,
        "index": "testindex_nested",
        "body": {
          "size": 0,
          "aggs": {
            "nested_patients": {
              "nested": { "path": "patients" },
              "aggs": {
                "by_name": {
                  "terms": { "field": "patients.name" },
                  "aggs": { "sum_total": { "sum": { "field": "patients.total" } } }
                }
              }
            }
          }
        }
      },
      "format": { "property": "aggregations.nested_patients.by_name.buckets" },
      "transform": [
        { "type": "formula", "expr": "datum.sum_total.value", "as": "sum_total_value" }
      ]
    }
  ],
  "scales": [
    { "name": "y", "type": "band", "domain": { "data": "patients", "field": "key" }, "range": { "step": 20 } }
  ],
  "marks": [
    {
      "type": "text",
      "from": { "data": "patients" },
      "encode": {
        "enter": {
          "y": { "scale": "y", "field": "key", "band": 0.5 },
          "x": { "value": 6 },
          "baseline": { "value": "middle" },
          "text": { "signal": "datum.key + ': ' + datum.sum_total_value" }
        }
      }
    }
  ]
}
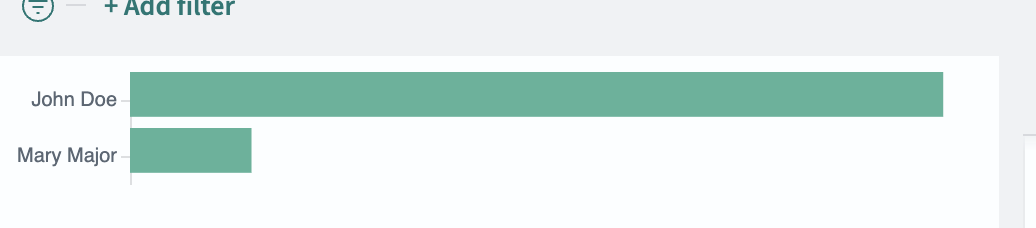
Or if you are looking for a more visual representation:
{
  "$schema": "https://vega.github.io/schema/vega/v5.json",
  "data": [
    {
      "name": "patients",
      "url": {
        "%context%": true,
        "index": "testindex_nested",
        "body": {
          "size": 0,
          "aggs": {
            "nested_patients": {
              "nested": { "path": "patients" },
              "aggs": {
                "by_name": {
                  "terms": { "field": "patients.name" },
                  "aggs": { "sum_total": { "sum": { "field": "patients.total" } } }
                }
              }
            }
          }
        }
      },
      "format": { "property": "aggregations.nested_patients.by_name.buckets" },
      "transform": [
        { "type": "formula", "expr": "datum.sum_total.value", "as": "sum_total_value" }
      ]
    }
  ],
  "scales": [
    { "name": "y", "type": "band", "domain": { "data": "patients", "field": "key" }, "range": { "step": 28 } },
    { "name": "x", "type": "linear", "domain": { "data": "patients", "field": "sum_total_value" }, "nice": true, "zero": true, "range": "width" }
  ],
  "axes": [
    { "orient": "left", "scale": "y" },
    { "orient": "bottom", "scale": "x" }
  ],
  "marks": [
    {
      "type": "rect",
      "from": { "data": "patients" },
      "encode": {
        "enter": {
          "y": { "scale": "y", "field": "key" },
          "height": { "scale": "y", "band": 0.8 },
          "x": { "scale": "x", "value": 0 },
          "x2": { "scale": "x", "field": "sum_total_value" },
          "tooltip": { "signal": "{name: datum.key, sum_total: datum.sum_total_value}" }
        }
      }
    }
  ]
}
This should produce: